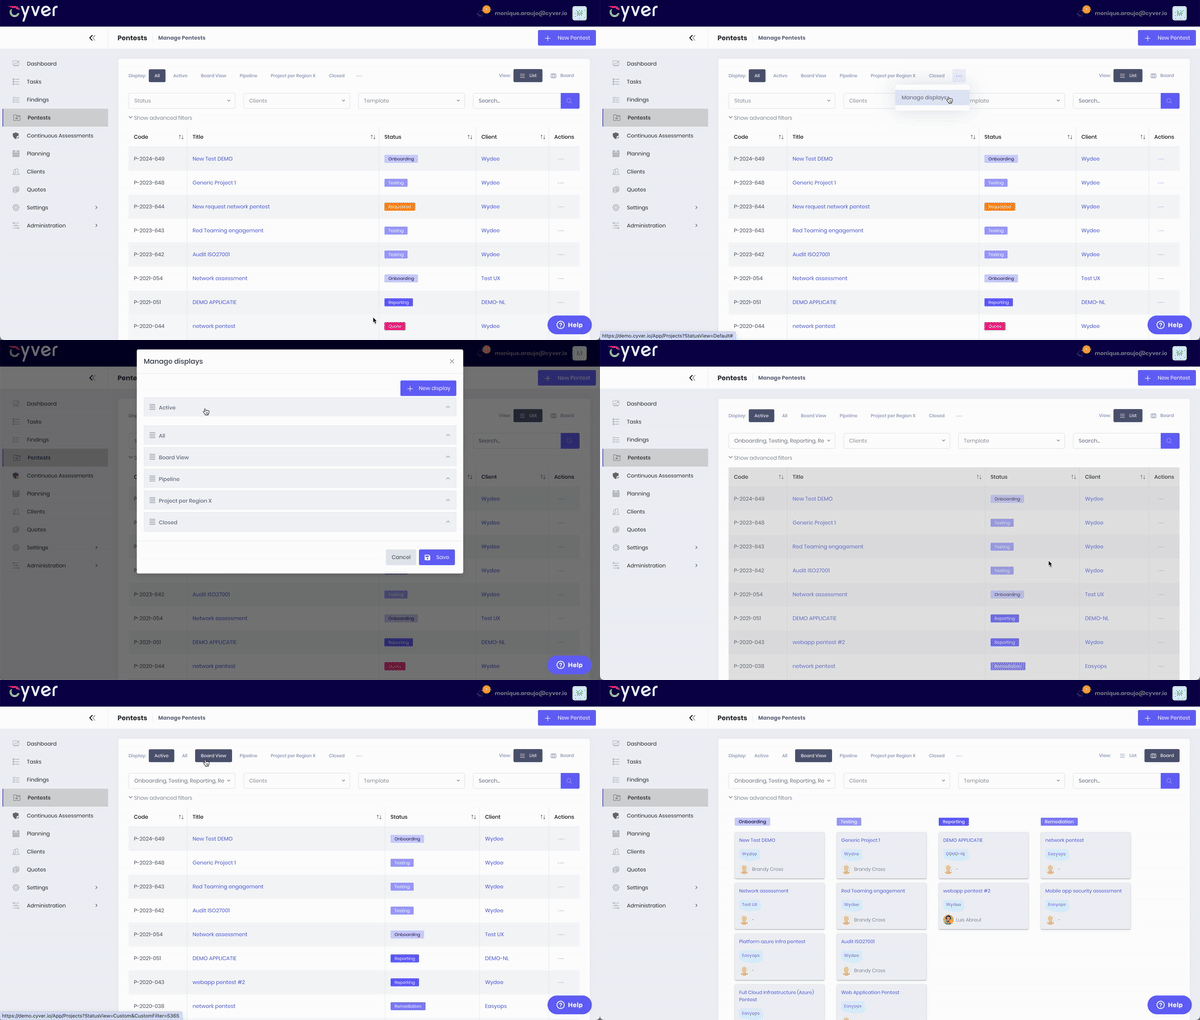
For many of our clients, Cyver Core is the primary tool you have for managing clients, incoming work, and pentests. That often means having anywhere from a few to hundreds of clients in the platform, complete with their teams, their pentests, and all their assets. Searching and filtering those clients and their assets is necessary for seeing work, clients, and where they come from.
Cyver already uses labels and filters to allow you to sort through your clients. You can also create your own labels and tag based on anything you want. Some of our clients add labels for region, pentest type, asset type, start date, pentest team inside the organization, and much more.
However, until now, you’ve had to check those views individually by adding filters to your dashboard to see the specific views that you want. Now, you can create shortcuts or saved views so you can see those views with a single click.
That can mean:
- View clients per region
- See active pentests
- Create custom dashboard views per client
- See custom views per project (e.g., filtering types of project or projects by status)
- Organize displays into list or board views
You can then save those dashboards and have a button to click back to that view, on-demand, at any point.

Creating and saving your own dashboard views means that you can easily update your Cyver Core interface to show exactly the data you need, at the click of a button. This is one of our most requested features for the Cyver Core interface. In addition, it means you can more easily create custom dashboards for your own account, ensure that every project and team manager can see exactly what they need to see with minimum time investment, and set your Cyver Core dashboard up to share exactly the data you need.
If you’d like to see dashboard customization in action, contact us for a demo.

